


Cartography & Spatial
Information Design
Selected mapping, wayfinding & information design work
Practice Overview
What was it?
A selection of mapping, wayfinding, and spatial information design work created during my time at Reid Middleton. I worked with engineers, planners, marketers, and public-sector clients to transform GIS data and technical information into clear, visually structured maps and communication materials.
Who was it for?
Municipalities, public agencies, transportation organizations, engineering teams, and federal clients including NOAA and local governments throughout Washington State and the Pacific Northwest.
Design Challenge
Geographic and infrastructure data can become visually dense very quickly. Each project required balancing geographic accuracy with readability—establishing clear hierarchy across roads, landmarks, routes, labels, symbols, project locations, and supporting technical information.
Approach
I transformed GIS geometry into editable vector artwork and developed the visual presentation in Adobe Illustrator, defining typography, color, line weights, symbols, legends, labels, information hierarchy, and page composition. Depending on the project, I also created custom illustrations, wayfinding graphics, data visualizations, and branded presentation systems.
Scope of Work
GIS + Vector Mapping
Converted geographic data into refined, publication-ready vector maps
Typography + Hierarchy
Established labeling systems, scale, contrast, and geographic information hierarchy
Iconography + Wayfinding
Designed symbols, markers, legends, signage, and navigational communication
Brand + Data Visualization
Applied client visual systems across maps, diagrams, reports, and presentations
Selected Work
Material 1 — Washington State Roundabouts
Cartographic system & navigation booklet
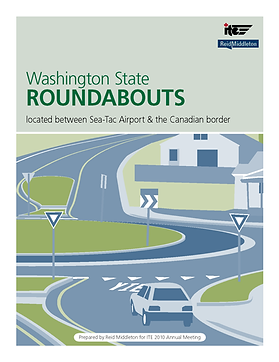
Designed a multi-map navigation booklet covering roundabouts between Sea-Tac Airport and the Canadian border. Developed a consistent cartographic language across regional maps, location markers, road hierarchies, legends, labels, and supporting navigation information.


Material 2 — NOAA Marine Operations Center
Spatial information & proximity mapping
Created regional and local maps communicating facilities, transportation routes, geographic boundaries, businesses, recreation, and proximity relationships for a major NOAA planning proposal.


Material 3 — City of Edmonds Project Priorities
Geographic data visualization
Visualized dozens of transportation and infrastructure priorities within a single geographic system, using color, symbols, line weight, numbering, and supporting typography to distinguish project types and locations.

Material 4 — City of Redmond Bicycle Wayfinding
Wayfinding & navigation system
Developed bicycle wayfinding graphics integrating physical routes, sign locations, destination hierarchy, directional signage, and implementation specifications across Redmond's trail network.


Material 5 — Mill Creek East Gateway
Technical cartography & infrastructure visualization
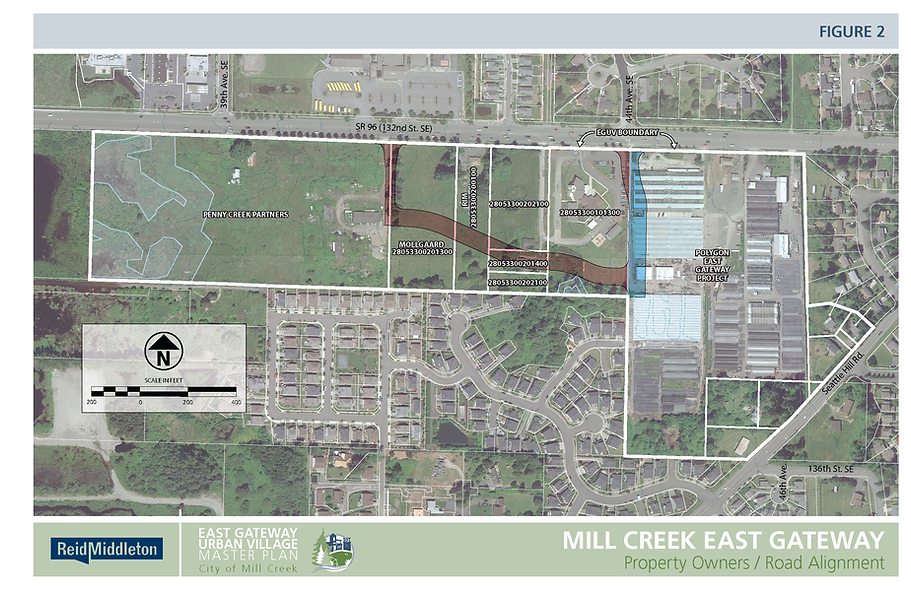
Created a coordinated series of maps for the City of Mill Creek East Gateway Urban Village Master Plan, translating GIS, parcel, transportation, and utility data into a consistent visual system. Developed geographic hierarchy, typography, color coding, legends, overlays, and technical annotations across regional context, property ownership, roadway, stormwater, water, and sanitary sewer views.


Feedback on the project? Want to discuss the tagging system further? You can find me on LinkedIn.