
Washington DNR School
Seismic Safety Report
Project Overview
What was it?
A Phase 1 public safety report for the Washington Department of Natural Resources’ School Seismic Safety Program. The report translated statewide geologic field assessments, engineering evaluations, school building surveys, maps, charts, and technical drawings into a clear visual summary of earthquake vulnerability across Washington public schools.
Who was it for?
Washington Department of Natural Resources, the governor, state legislature, school districts, engineers, and public stakeholders responsible for understanding school seismic risk and prioritizing future remediation efforts.
Problem
Washington State had identified school resilience as a top earthquake preparedness priority, but many public school buildings had not been evaluated against modern seismic safety standards. Phase 1 produced a large amount of technical geologic and engineering data, but that information needed to be organized into a format that state leaders, school districts, and non-technical audiences could quickly understand and act on.
Solution
I designed a comprehensive Phase 1 report and visual communication system that made complex seismic safety findings easier to compare, interpret, and prioritize. The final materials helped communicate risk across 222 public school buildings, supported submission to state leadership and participating school districts, and contributed to the foundation for Phase 2 of the School Seismic Safety Program.
Outcome
Results
222
Schools
Buildings evaluated
for seismic
vulnerability
94
Campuses
assessed for
NEHRP seismic
site class
15
Buildings
selected for deeper analysis and upgrade cost evaluation
$100
Million
Initial state funding allocated for safety enhancements
The Experience
Material 1 — Phase 1 Final Report
Structured the final report submitted to the governor, legislature, and participating school districts.


Material 2 — Statewide Risk Maps
Visualized where school campuses and vulnerable buildings were located across Washington.

Material 3 — Engineering Data Visualizations
Created charts and graphics that made seismic evaluations, building conditions, and consultant findings easier to compare.


Material 4 — School-Specific Analysis Materials
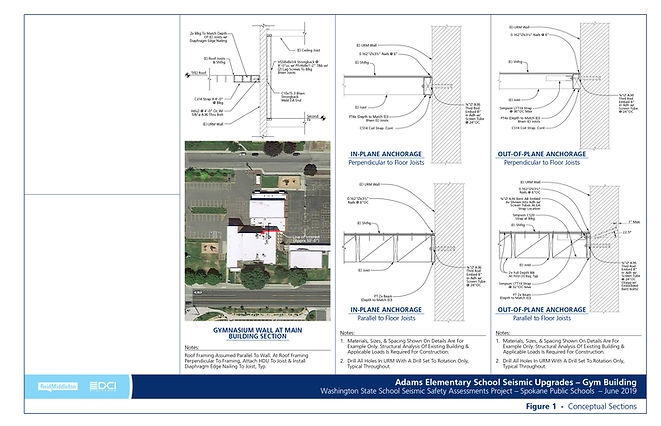
Presented CAD drawings, detailed building analysis, and upgrade-priority visuals that helped connect technical findings to future remediation planning.

Feedback on the project? Want to discuss the tagging system further? You can find me on LinkedIn.